library(mizer)

species_params <-
    data.frame(species = c("speciesA", "speciesB"),
               w_inf = c(500, 5000),
               k_vb = c(0.8, 0.3),
               w_min = c(0.001, 0.001),
               beta = c(1000,100),
               sigma = c(3,3))
species_params$interaction_resource <- c(1,0.5)
params <- newMultispeciesParams(species_params, no_w = 200, kappa = 0.0001) |>
steady(tol = 0.001)Temperature-dependent rates in mizer
package
Temperature is an important driver of ecosystem change. Now you can include it in mizer.
Introduction
therMizer models the effects of temperature on individuals’ aerobic scope and metabolic rate using an approach that requires minimal parameterization. This allows you to easily incorporate dynamic temperature-dependent rates into mizer, enabling simulations to include an important climate-related driver.
Aerobic scope
The relationship between aerobic scope and temperature is a somewhat left-skewed distribution with a thermal optimum and upper and lower thermal tolerance limits. Pörtner and Peck (2010) provide an overview of this relationship and Pörtner (2012) discusses open questions related to temperature and physiology. The exact nature of the relationship between aerobic scope and temperature varies by species and requires a fair bit of physiological research to establish. Therefore, it is generally necessary to approximate this relationship, which is what therMizer does. A generic polynomial rate equation is used to approximate the effect of temperature on aerobic scope, s: \[\begin{align} s = T(T - T_{min})(T_{max} - T)^\frac{1}{2} && \text{(1)} \end{align} \] where T is the temperature to which a fish is exposed and \(T_{max}\) and \(T_{min}\) are the species’ upper and lower thermal tolerance limits, respectively (van der Heide et al. 2010). All temperatures in eq. (1) are in Kelvin. The result of this expression varies considerably given a species’ thermal tolerance limits. Therefore, it is necessary to scale this value across all modeled species so that it equals a value ranging from 0 – 1. This is done by dividing by the maximum value over each species’ thermal range (Woodworth-Jefcoats et al. 2019). therMizer will take care of this scaling for you.
The scaled value is then used as a multiplier for encounter rate and predation rate in mizer. The scaling is applied to encounter rate as proxy for foraging movement. The resulting temperature effect is such that when species are at their thermal optima they realize peak aerobic performance and encounter the maximum amount of prey possible. This ability diminishes to either side of the optimum and reaches zero outside species’ thermal tolerance limits. The scaling is applied to predation rate to ensure encountered prey are predated upon.
Metabolic rate
The relationship between metabolic rate and temperature is exponential and positive (see, for example, Brown et al. 2004). To simulate this, therMizer uses a Boltzmann factor or Arrhenius relation: \[ \begin{align} r = e^{25.22-\frac{E}{kT}} && \text{(2)} \end{align} \] where r is the effect of temperature on metabolic rate, E is activation energy (0.63 eV), k is Boltzmann’s constant (\(8.62 \times 10^{-5}\) eV K\(^{-1}\)), and T is temperature in Kelvin (Brown et al. 2004, Jennings et al. 2008). The result of this expression varies depending upon the temperature to which species are exposed, which is in turn a factor of species’ thermal tolerance limits. Therefore, it is necessary to scale this value across all species so that it equals a value ranging from 0 – 1. This is done by subtracting the minimum value over each species’ thermal range and then dividing the result by the range (Woodworth-Jefcoats et al. 2019). therMizer will take care of this scaling (and converting from degrees C to Kelvin) for you when you.
The scaled value is then used as a multiplier for standard metabolism in therMizer. This has the effect of metabolism being the least expensive when species are at the low end of their thermal tolerance and the most expensive at the upper limits of their thermal tolerance.
Finally, therMizer sets the rate scalings to 0 outside species’ thermal range, simulating the assumption that species would move out of waters that are either too warm or too cool.
Model input
The only additional input you’ll need to provide, beyond what’s needed to run mizer, are three temperature values for each species. temp_min and temp_max represent the lower and upper bounds of a species’ thermal tolerance limits. You can find this information in the literature or in databases such as rfishbase (Boettiger et al. 2012). You also need to provide ocean_temp, the temperature to which species are exposed. This can be static or dynamic, and informed from either empirical or modeled data. Temperatures are input in degrees Celsius. therMizer will convert them to Kelvin.
That’s it. That’s all you need.
A simple simulation
Let’s do a simple simulation with two fictional fish species. We’ll need to invent some parameters for them:
Add their hypothetical thermal tolerance limits:
species_params(params)$temp_min <- c(15, 10)
species_params(params)$temp_max <- c(25, 20)
And, finally, the temperatures to which each species is exposed. To make it interesting, we’ll have one species eventually encounter temperatures beyond its thermal tolerance limits.
# Create temperature array and fill it
times <- 0:500
species <- species_params(params)$species
ocean_temp_array <- array(NA, dim = c(length(times), length(species)),
                          dimnames = list(time = times, sp = species))
temp_inc <- 0
for (i in 1:501) {
  ocean_temp_array[i,] <- c(17 + temp_inc, 17 + temp_inc)
  temp_inc <- temp_inc + 0.01
}
other_params(params)$ocean_temp <- ocean_temp_array
Now that we’ve put in all the necessary temperature information, we can add the code that tells mizer how to use it. First, the parameters needed to do the scaling that’s mentioned above:
# Create parameter for scaling encounter and mortality rates
species_params(params)$encounterpred_scale <-
    rep(NA, nrow(species_params(params)))

for (indv in seq(1:length(species_params(params)$temp_min))) {

    # Create a vector of all temperatures each species might encounter
    temperature <- seq(species_params(params)$temp_min[indv],
                       species_params(params)$temp_max[indv],
                       by = 0.1) + 273

    # Find the maximum value of the unscaled effect of temperature on encounter
    # and predation rate for each species
    species_params(params)$encounterpred_scale[indv] <-
        max((temperature) *
                (temperature - (species_params(params)$temp_min[indv] + 273)) *
                ((species_params(params)$temp_max[indv] + 273) - temperature)^(1/2)
            )
}

# Determine the minimum, maximum, and range of value for the effect of
# temperature on metabolism

min_metab_value <-
    (exp(25.22 - (0.63/((8.62e-5)*(273 + species_params(params)$temp_min)))))
max_metab_value <-
    (exp(25.22 - (0.63/((8.62e-5)*(273 + species_params(params)$temp_max)))))

species_params(params)$metab_min <- min_metab_value
species_params(params)$metab_range <- max_metab_value - min_metab_value
Then, we can add code to scale encounter rate and predation rate based on the temperature at a given time step:
# Calculate the temperature scaling factor for the encounter rate and
# predation rate
scaled_temp_effect <- function(t) {
    # Using t+1 to avoid calling ocean_temp[0,] at the first time step
    temp_at_t <- other_params(params)$ocean_temp[t + 1,] + 273

    # Calculate unscaled temperature effect using a generic polynomial rate equation
    unscaled_temp_effect <-
        temp_at_t * (temp_at_t - (species_params(params)$temp_min + 273)) *
        ((species_params(params)$temp_max + 273) - temp_at_t)^(1/2)

    # Scale using new parameter
    scaled_temp_effect <-
        unscaled_temp_effect / species_params(params)$encounterpred_scale

    # Set temperature effect to 0 if temperatures are outside thermal
    # tolerance limits
    above_max <- (temp_at_t - 273) > species_params(params)$temp_max
    below_min <- (temp_at_t - 273) < species_params(params)$temp_min
    scaled_temp_effect[above_max | below_min] = 0

    scaled_temp_effect
}


therMizerEncounter <- function(params, t, ...) {

      # Calculate maximum possible encounter rate
      max_encounter <- mizerEncounter(params, t, ...)

      # Apply temperature effect
      return(max_encounter * scaled_temp_effect(t))

}

therMizerPredRate <- function(params, t, ...) {
      # Calculate maximum possible encounter rate
      max_predrate <- mizerPredRate(params, t, ...)

      # Apply temperature effect
      return(max_predrate * scaled_temp_effect(t))

}
As well as metabolic rate:
therMizerEReproAndGrowth <- function(params, t, encounter, feeding_level, ...) {

    # Using t+1 to avoid calling ocean_temp[0,] at the first time step
    temp_at_t <- other_params(params)$ocean_temp[t + 1,]

    # Arrhenius equation
    unscaled_temp_effect <- (exp(25.22 - (0.63/((8.62e-5)*(273 + temp_at_t)))))

    # Arrhenius equation scaled to a value between 0 and 1
        temp_effect_metabolism <-
            (unscaled_temp_effect - species_params(params)$metab_min) /
            species_params(params)$metab_range

        # Set temperature effect to 0 if temperatures are outside thermal
        # tolerance limits
    above_max <- temp_at_t > species_params(params)$temp_max
    below_min <- temp_at_t < species_params(params)$temp_min
    temp_effect_metabolism[above_max | below_min] = 0

    # Apply scaled Arrhenius value to metabolism
    sweep((1 - feeding_level) * encounter, 1,
          species_params(params)$alpha, "*", check.margin = FALSE) -
        metab(params)*temp_effect_metabolism

}
Finally, we need to replace mizer’s rate functions with our new temperature-dependent rate functions:
params <- setRateFunction(params, "Encounter", "therMizerEncounter")
params <- setRateFunction(params, "PredRate", "therMizerPredRate")
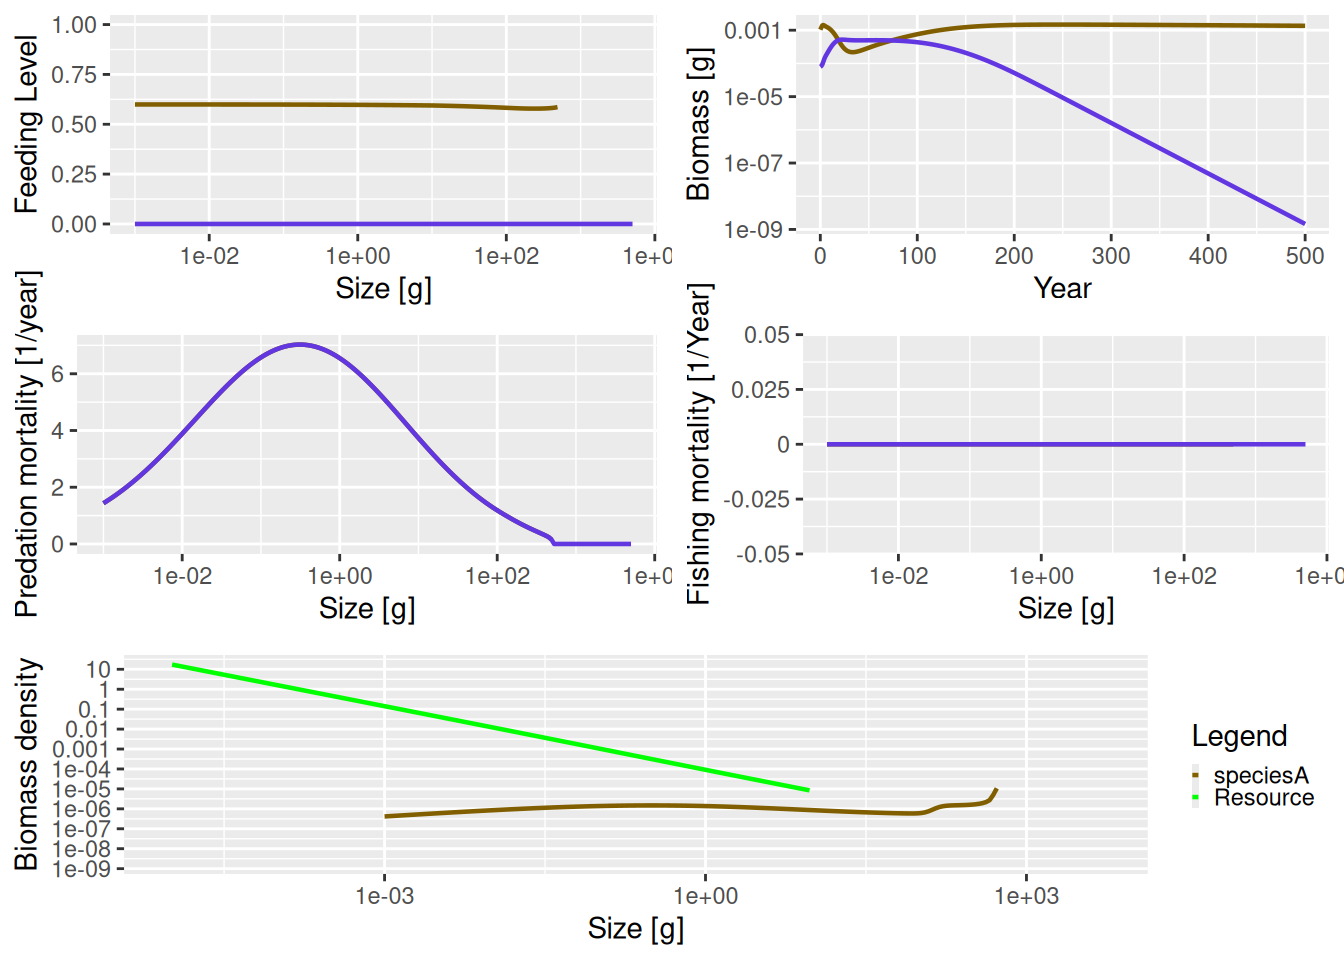
params <- setRateFunction(params, "EReproAndGrowth", "therMizerEReproAndGrowth")Let’s see what a simulation looks like.
Adapting this for a data-based simulation
You’re likely going to want to do simulations based on real species and real temperature observations or projections. This is straightforward to do. When you prepare your species parameters, add temp_min and temp_max columns for each species. You’ll also need to prepare an ocean_temp input with dimensions that match those of time and species.
Once you’ve prepared your input, you can use the code above to create and use the encounterpred_scale, metab_min, and metab_range parameters and the therMizerEncounter, therMizerPredRate, and therMizerEReproAndGrowth rate functions.
In the works
Many fish undergo ontogentic migration, spending different life stages at different depths and therefore different thermal habitats. I’m working on adding to therMizer the capacity for different size classes to experience different temperatures.
Acknowledgements
This blog post was compiled with mizer version 2.3.1 and R version 4.2.1. Many thanks to Gustav Delius for guidance on mizer’s inner workings and writing better code. Thank you also to Romain Forestier for insight on working with temperatures below 0\(^\circ C\).
Update note
Post updated on 19/09/22: The equation for aerobic scope was changed to allow users to input negative Celsius temperature. To accommodate this, temperatures are now converted to Kelvin and the square root of the final polynomial term is taken to preserve the curve shape.
References
Boettiger C, Lang DT, Wainwright PC. (2012) rfishbase: exploring, manipulating, and visualizaing FishBase from R. Journal of Fish Biology 81, 2030–2039. https://doi.org/10.1111/j.1095-8649.2012.03464.x
Briere J-F, Pracros P, Le Roux A-Y, Pierre J-S. (1999) A novel rate model of temperature-dependent development in arthropods. Population Ecology, 28(1): 22-29. https://doi.org/10.1093/ee/28.1.22
Brown JH, Gillooly JF, Allen AP, Savage VM, West GB. (2004) Toward a metabolic theory of ecology. Ecology, 85: 1771–1789. https://doi.org/10.1890/03-9000
Jennings S, Mélin F, Blanchard JL, Forster RM, Dulvy NK, Wilson RW. (2008) Global scale predictions of community and ecosystem properties from simple ecological theory. Proceedings of the Royal Society B, 275: 1375–1383. https://doi.org/10.1098/rspb.2008.0192
Pörtner HO. (2012) Integrating climate-related stressor effects on marine organisms: unifying principles linking molecule to ecosystem-level changes. Marine Ecology Progress Series, 470: 273–290. https://doi.org/10.3354/meps10123
Pörtner HO, Peck MA. (2010) Climate change effects on fishes and fisheries: toward a cause-and-effect understanding. Journal of Fish Biology, 77: 1745–1779. https://doi.org/10.1111/j.1095-8649.2010.02783.x
van der Heide T, Roijackers RMM, van New EH, Peeters ETHM. (2006) A simple equation for describing the temperature dependent growth of free-floating macrophytes. Aquatic Botany, 84: 171–175. https://doi.org/10.1016/j.aquabot.2005.09.004
Woodworth-Jefcoats PA, Blanchard JL, Drazen JC. (2019) Relative Impacts of Simultaneous Stressors on a Pelagic Marine Ecosystem. Frontiers in Marine Science, 6:383. https://doi.org/10.3389/fmars.2019.00383